Physical Address
304 North Cardinal St.
Dorchester Center, MA 02124
Physical Address
304 North Cardinal St.
Dorchester Center, MA 02124

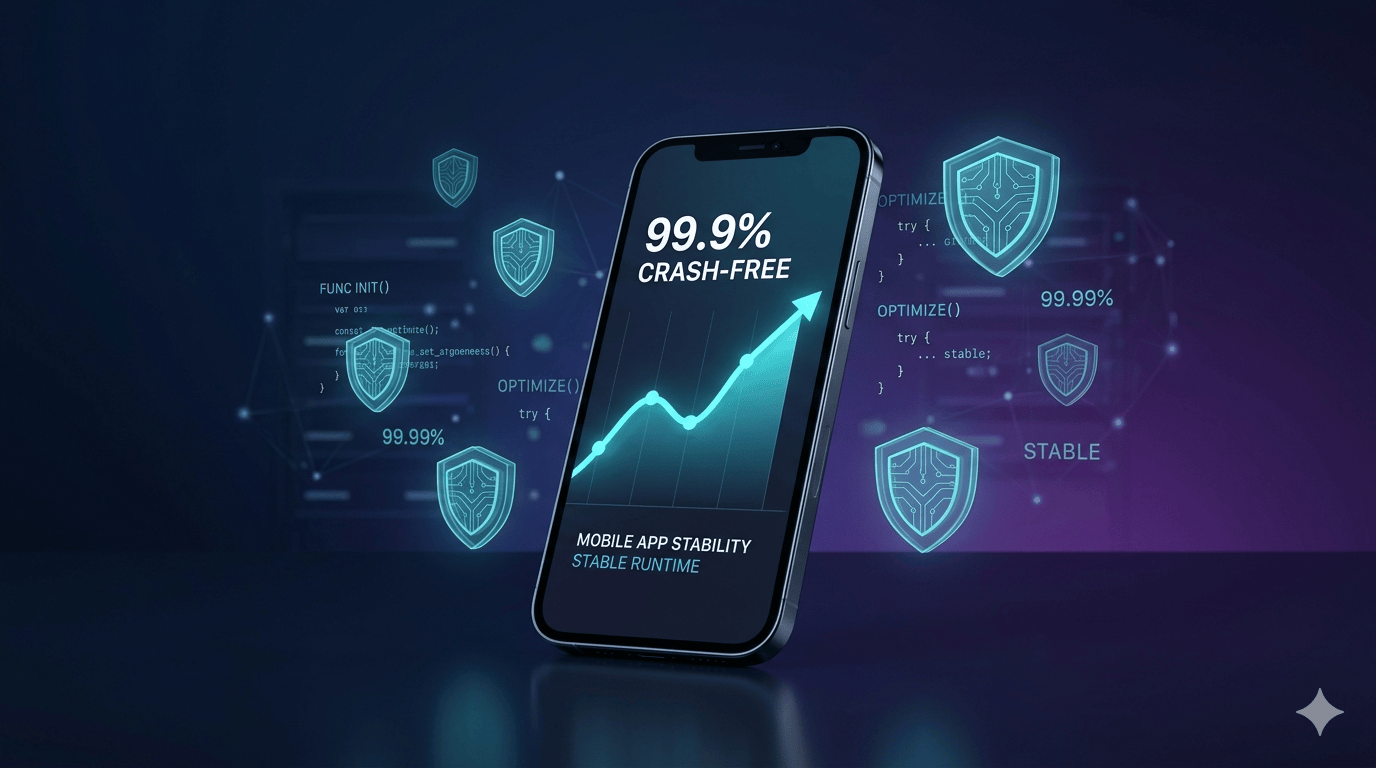
App crashes represent the ultimate silent adversary to growth. You might dedicate months to refining your user interface and streamlining your conversion paths, but when the application terminates without warning, users will not simply close the application, they will uninstall it.
For engineering teams and startups, sustaining a low crash rate extends far beyond a simple technical benchmark; it serves as a direct catalyst for user retention, visibility in App Store rankings, and overall revenue generation.
Your crash rate measures the percentage of total sessions or distinct users who encounter a fatal application error. While “99% crash-free” may sound commendable on a dashboard, in a large-scale environment a 1% crash rate indicates that 1 out of every 100 users is suffering a completely broken experience.
Elite applications strive for “three nines” (99.9%) reliability. Falling short of this standard results in:

To resolve crashes effectively, one must first identify their origin. The majority of production failures can be categorized into the following areas:
1. Unhandled Exceptions and Null Pointer Errors
This is the quintessential crash scenario. Whether triggered by a null value retrieved from a local database or an unexpected data type returned from a REST API, the failure to gracefully catch these exceptions leads to immediate application termination.
2. Memory Leaks and Resource Depletion
Intensive computations or the failure to properly release view controllers and listeners can culminate in Out of Memory (OOM) crashes. This issue is especially pervasive on mid-range and entry-level devices where system memory is severely constrained.
3. Volatile Network Conditions and API Failures
Contemporary applications depend heavily on distributed microservices. If a backend endpoint returns a 500 Internal Server Error or a malformed JSON payload, and your client-side parsing logic lacks defensive measures, the application will likely crash while attempting to map the inconsistent data structure.
4. Conflicts with Third-Party SDKs
External libraries used for analytics, advertisements, or payment processing often function as opaque components. An update to a single SDK can inadvertently introduce performance regressions or background threading conflicts that are notoriously challenging to trace and resolve.
5. State Management Inconsistencies
Within complex mobile interfaces, navigating rapidly between screens while asynchronous data is still in transit can create race conditions. This occurs when the UI attempts to render or update a state that has been invalidated or removed during the transition.
1. Embrace Defensive Programming
Refrain from coding exclusively for ideal scenarios.
2. Integrate Real-Time Observability
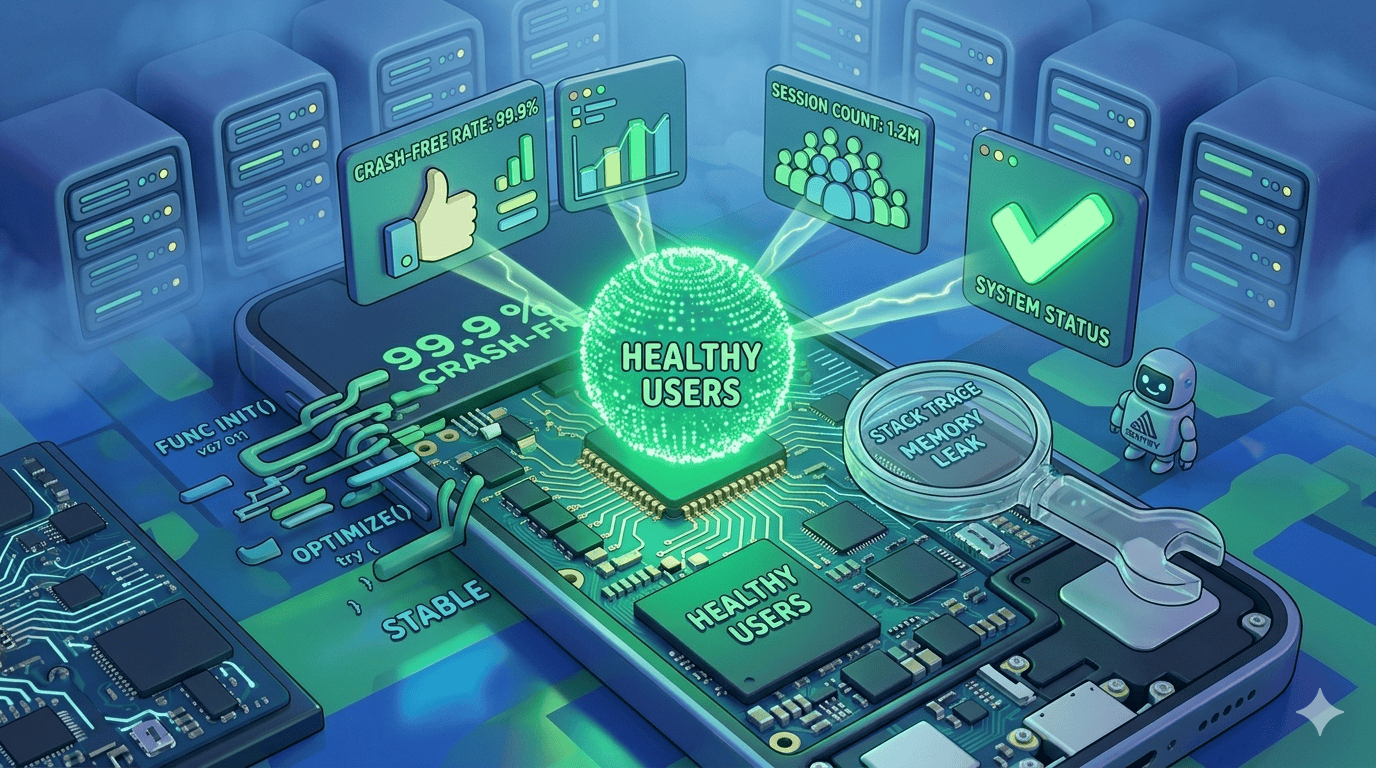
You cannot remediate an issue you cannot observe. Platforms like Firebase Crashlytics and Sentry are indispensable for any application operating in production.
3. Adopt the Circuit Breaker Pattern
If a particular feature or downstream API is identified as the source of repeated app crashes, utilize a Circuit Breaker mechanism. This allows the application to detect the failing component, effectively “trip” the circuit, and either disable the feature gracefully or present a non-intrusive maintenance message, thereby preserving the stability of the broader application.
4. Conduct Rigorous Performance Profiling
Regularly evaluate your application on physical hardware, not merely within simulator environments. Employ profiling tools to scrutinize:
5. Automate Testing within the CI/CD Pipeline
Shift your quality assurance efforts to earlier stages of development.
When a high-severity crash emerges in the production environment, response time is critical.
Reducing application crash rates is not a singular initiative; it is an ongoing commitment to engineering discipline. By placing a premium on stability, you are not merely correcting defects, but cultivating a product that earns and maintains user trust while scaling reliably.
Interested in building high-performance, stable applications? Discover additional engineering perspectives at Techlava.
Suggested Next Read – Native vs. Cross-Platform Mobile Development: What’s the Right Call for Your Startup?